
Urban Health Index (UHI) for Lambeth and Southwark 2023
With the Social Progress Imperative, we've developed the first neighbourhood level, health-focused social progress index of its kind.
Read more

Data and analytics
Our data team investigate what the 2021 census reveals about Lambeth and Southwark.

The census is undertaken by the Office for National Statistics every 10 years. It gives us a picture of all the people and households in England and Wales.
The first results from the 2021 Census of Population and Housing were released last week.
But what does the data mean for our boroughs of Lambeth and Southwark?
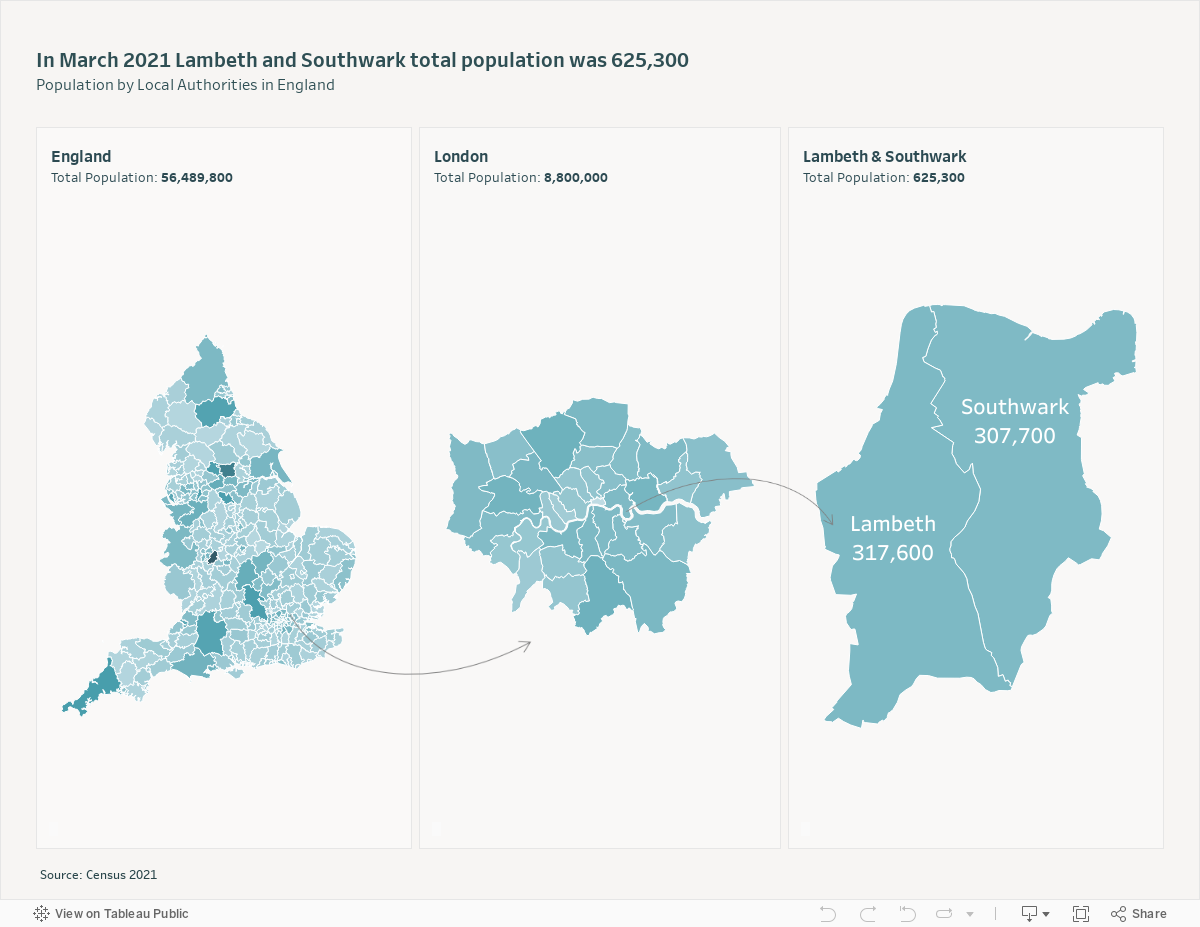
Our boroughs of Lambeth and Southwark are situated within South London. Together, and with 12 other boroughs, they form part of Inner London.
In 2021, the population of Lambeth was 317,600.
In 2021, the population of Southwark was 307,700.
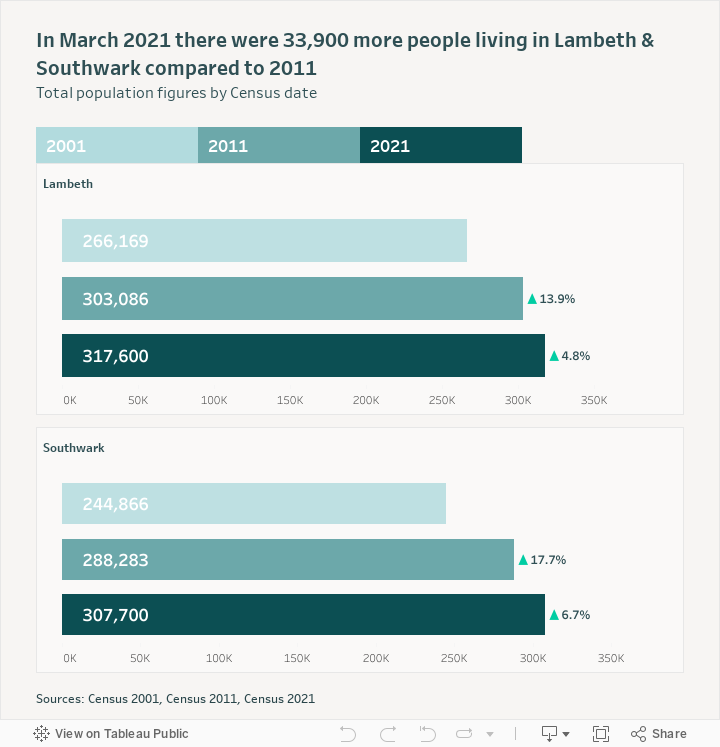
In the past decade, our boroughs saw a population increase of almost 34,000 people.
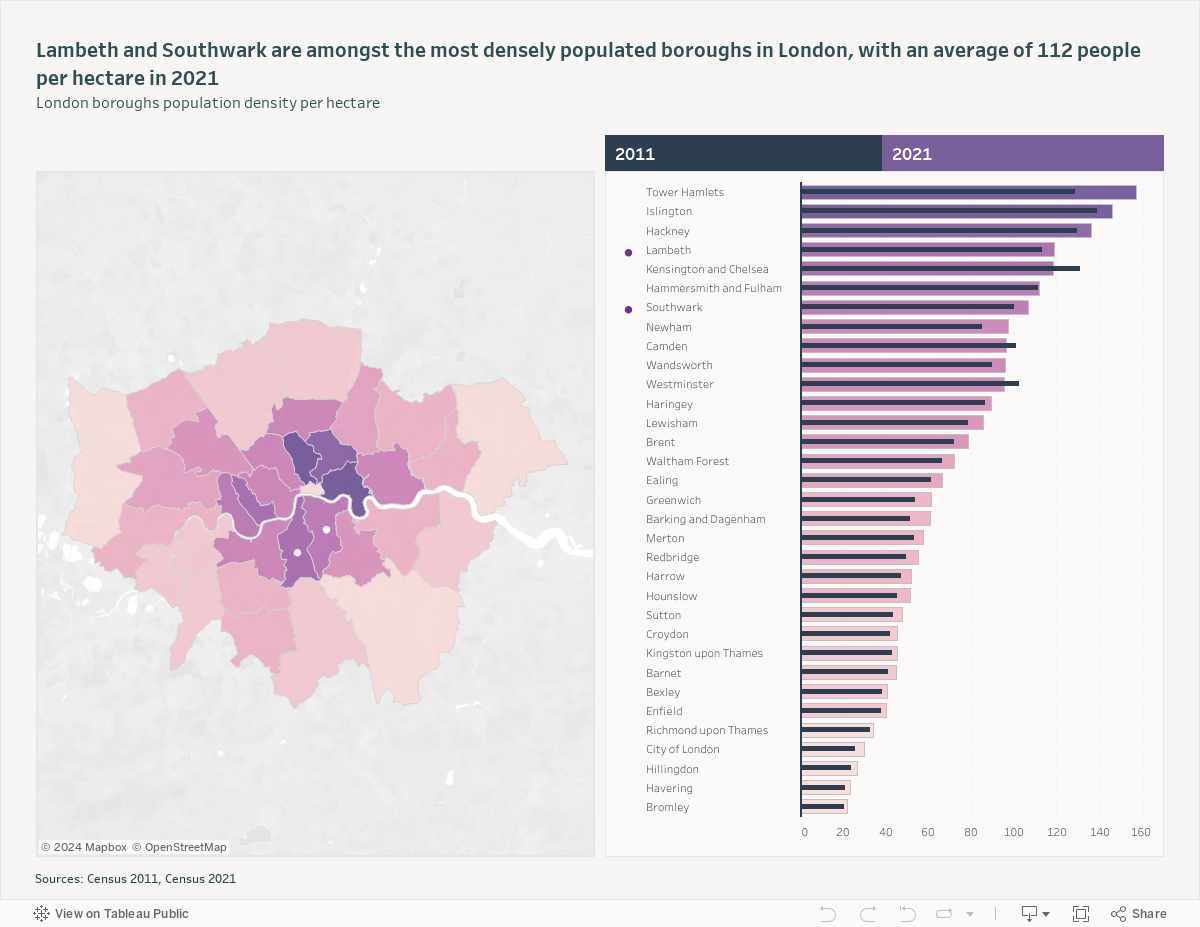
Lambeth and Southwark were among the most densely populated boroughs in London, ranking 4th and 7th respectively.
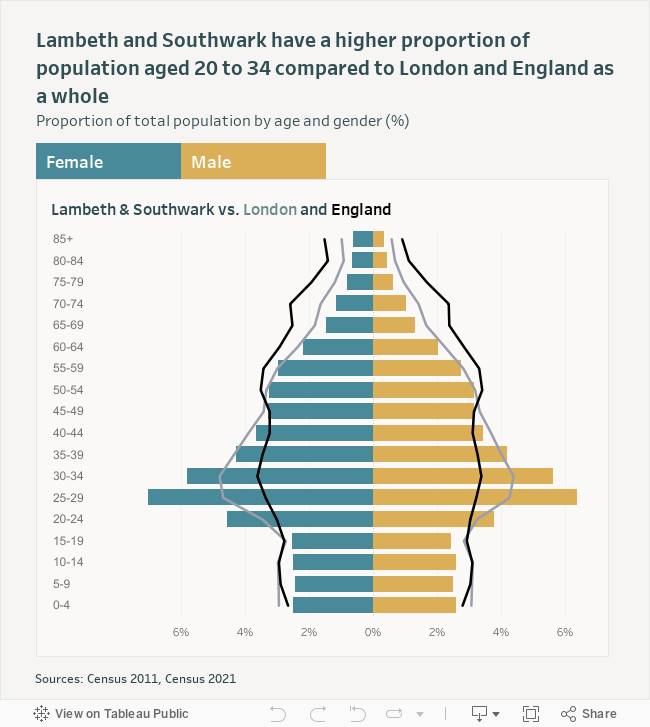
There are less children and more older people aged 50-74 living in Lambeth and Southwark compared to 2011.
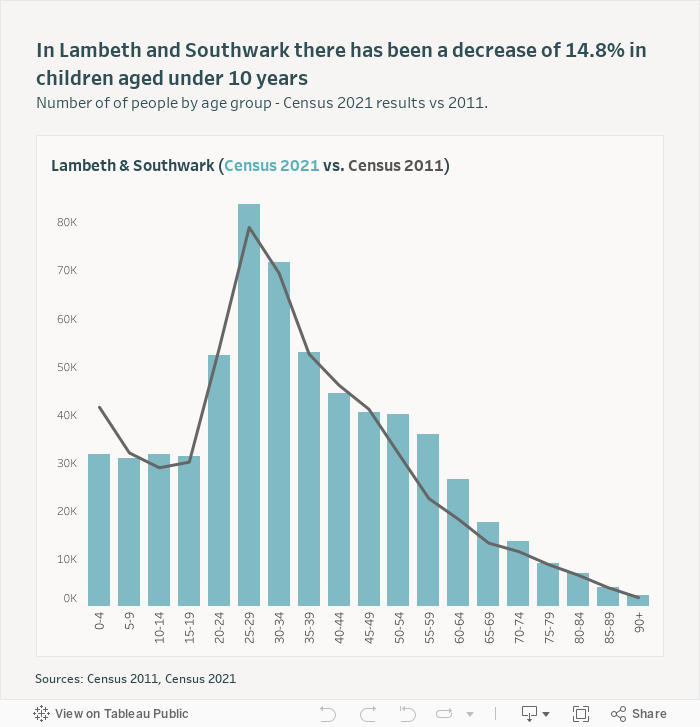
Despite the population in both Lambeth and Southwark being older than in 2011, both boroughs have a greater proportion of young, working age people compared to both London and England.
The census results so far have relevancy for all of our programmes as we focus on the social determinants of health.
The results from the 2021 census are still being released. We’ll be updating this page in line with these releases, so be sure to check back regularly for updates.
Urban health
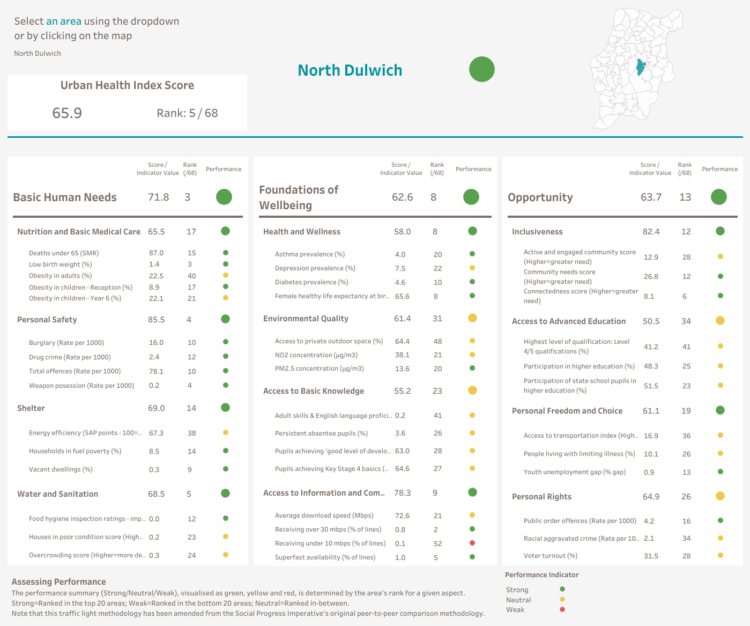
With the Social Progress Imperative, we've developed the first neighbourhood level, health-focused social progress index of its kind.
Health effects of air pollution
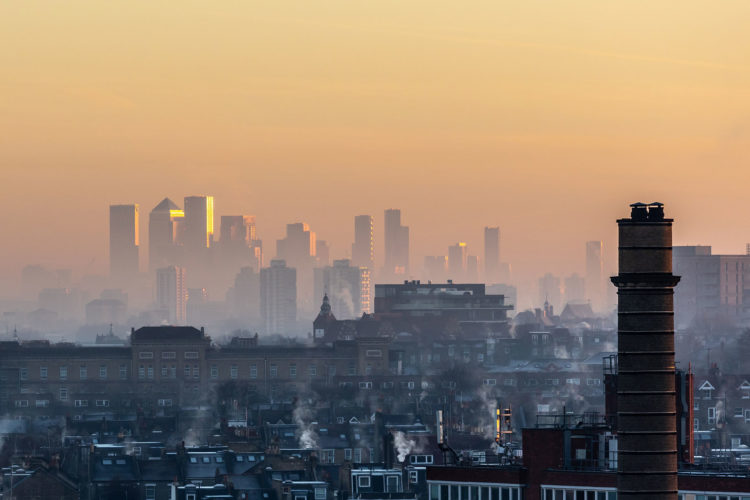
For the first time since August 2020, a high pollution warning has been issued for London. We explore what the major causes of air pollution are in London.
Data and analytics • Urban health
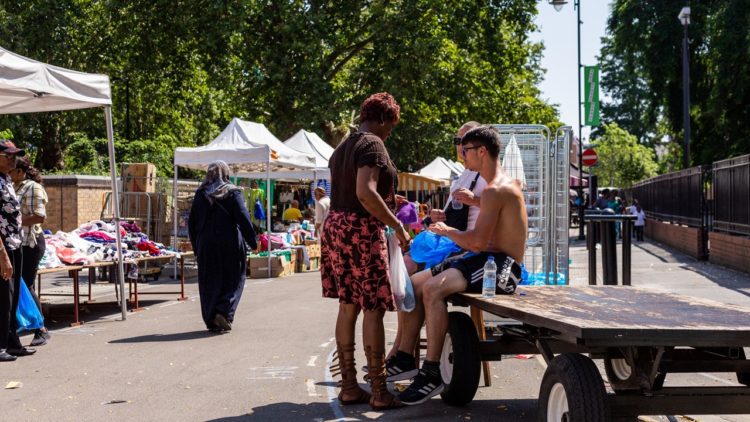
The difference in healthy life expectancy between the richest and poorest neighbourhoods in Lambeth and Southwark is up to 17 years. Explore our data snapshot to find out what factors contribute to this inequality.