
Census 2021: How ethnically diverse are our London boroughs?
We have used the Simpson’s Diversity Index (SDI) methodology to measure community diversity and what it means for Lambeth and Southwark.
Read more
Data
Explore the Urban Health Index, which looks at the social and environmental factors that shape the health of people living in Lambeth and Southwark.
The Urban Health Index helps us to understand the social and environmental factors shaping people’s health in Lambeth and Southwark. Read more about the Urban Health Index 2025 and how you might use it.
For the best experience, view the dashboard on a desktop.

The Urban Health Index uses social, health and environmental data to show how healthy a neighbourhood is, and help users understand potential barriers to good health in urban places.
It allows you to compare neighbourhoods, as well as understand areas of relative strength and weakness in each ward.
To help users apply the UHI to their context and needs, there are different views of the UHI data:
See the user guide (pdf) for further details on how you can use the UHI.
The indicators are grouped into three key dimensions, with each containing a number of components:
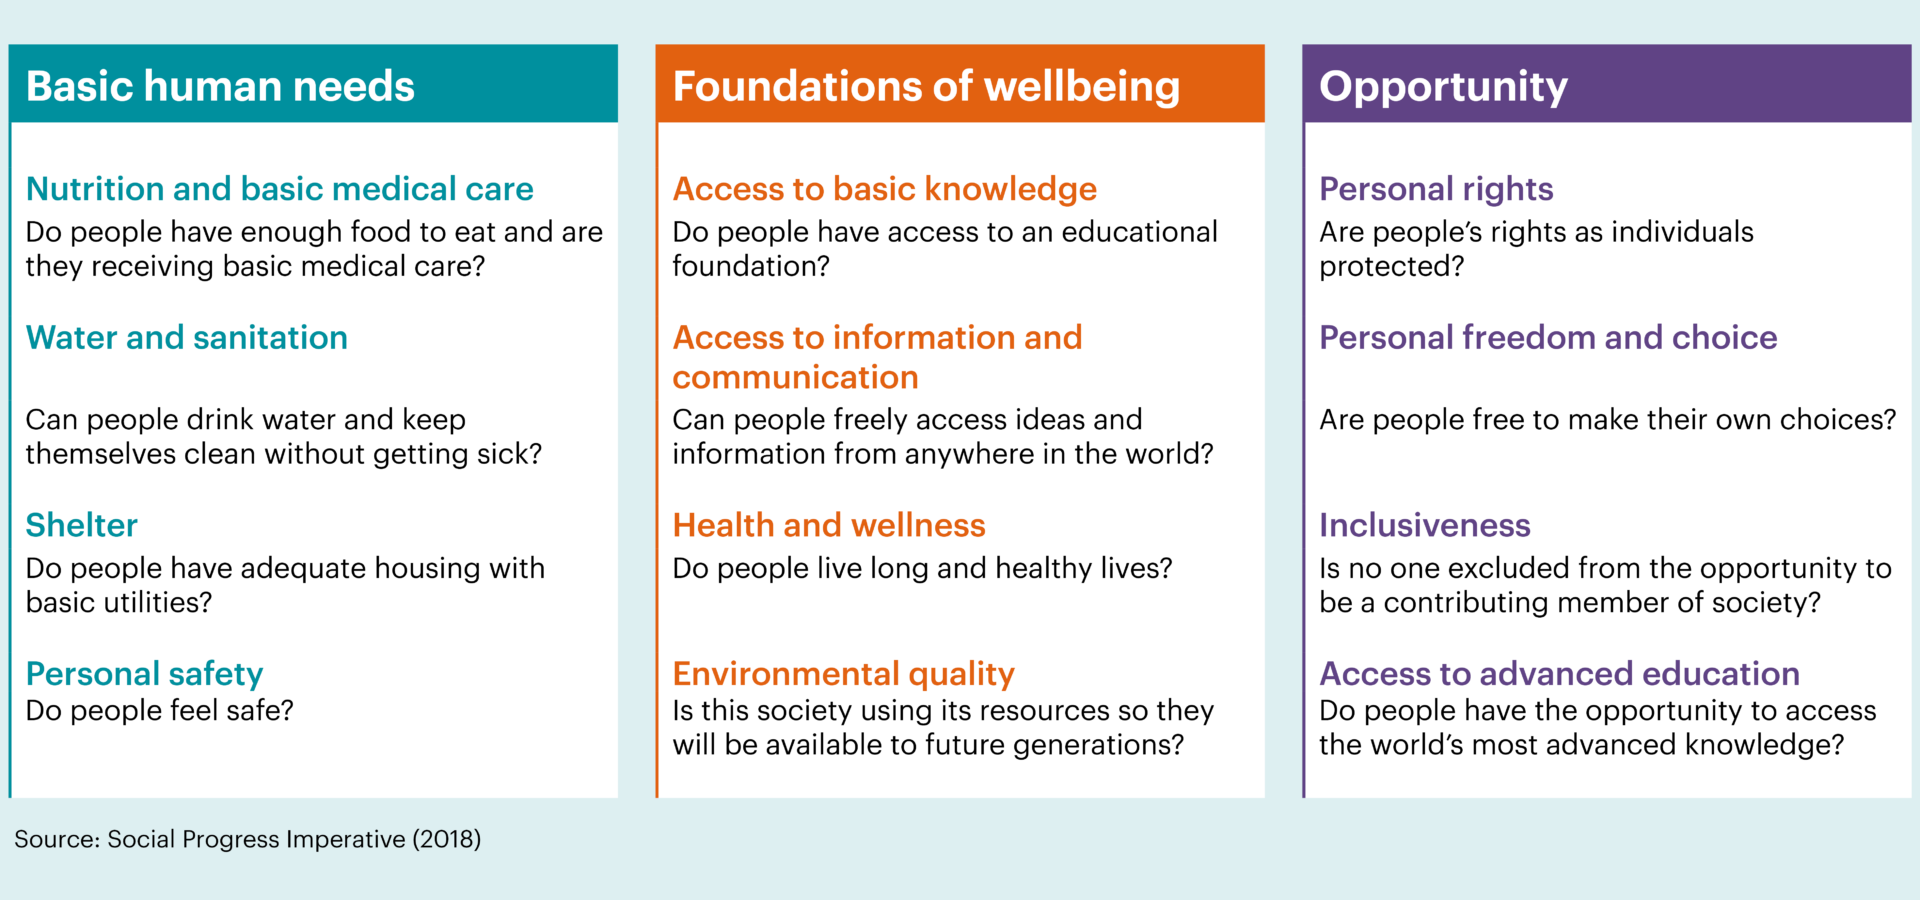
The three dimensions are:
The first version of the Urban Health Index was published in 2021, and then updated in 2023. You can view both data dashboards below:
Data and analytics

We have used the Simpson’s Diversity Index (SDI) methodology to measure community diversity and what it means for Lambeth and Southwark.
Data

Four years ago, we launched our first Urban Health Index. In this blog, we take a closer look at the updated Index – and what it tells us about health inequality within Lambeth and Southwark.
Data

Some neighbourhoods in Lambeth and Southwark sit close to opportunities on the map but remain cut off from them - shaped by overlapping pressures in people's daily lives. The 2025 Urban Health Index reveals this overlooked pattern, and what it means for the people living it.