How has the population changed in Lambeth and Southwark?
Our data team investigate what the 2021 census reveals about Lambeth and Southwark.
Read more
Data and analytics
Ethnic populations in London boroughs


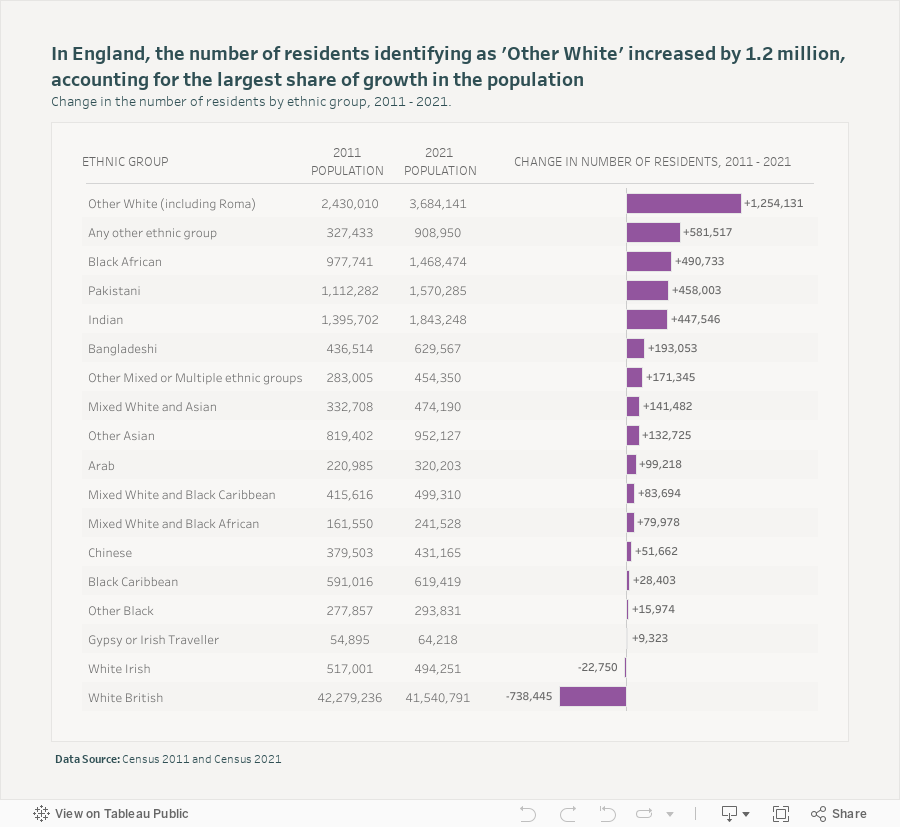
Data from the latest Census reveals the population of England and Wales by ethnicity:
The 2021 Census shows that the population in England increased by 7% to 56.5 million in the last decade, and has become more ethnically diverse.
In 2011, 10.7 million people reported being from a “non White-British” ethnic group, while in 2021 this number increased by 39% to almost 15 million. People identifying as “Other White” (all White people who are not White-British, Irish, Gypsy or Irish Traveller) accounted for the largest share of growth in the total population.
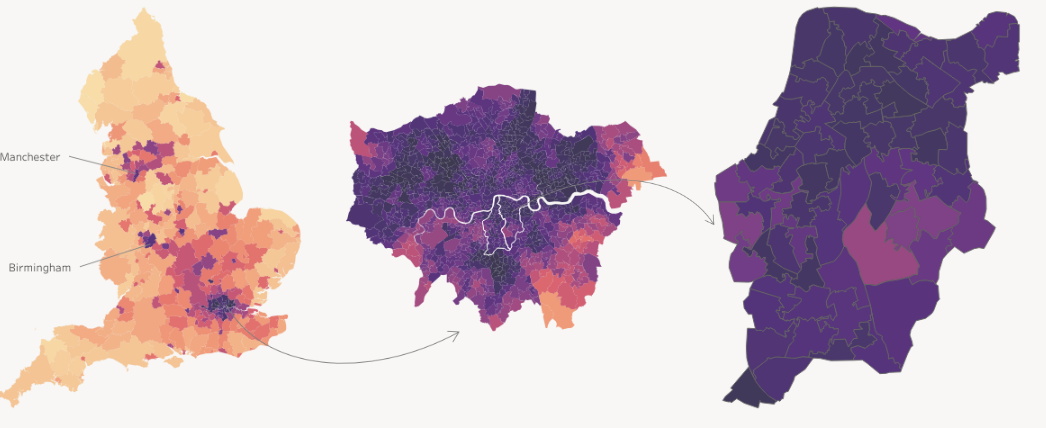
London is the most ethnically diverse region in England and Wales. Data on London ethnicity indicates:
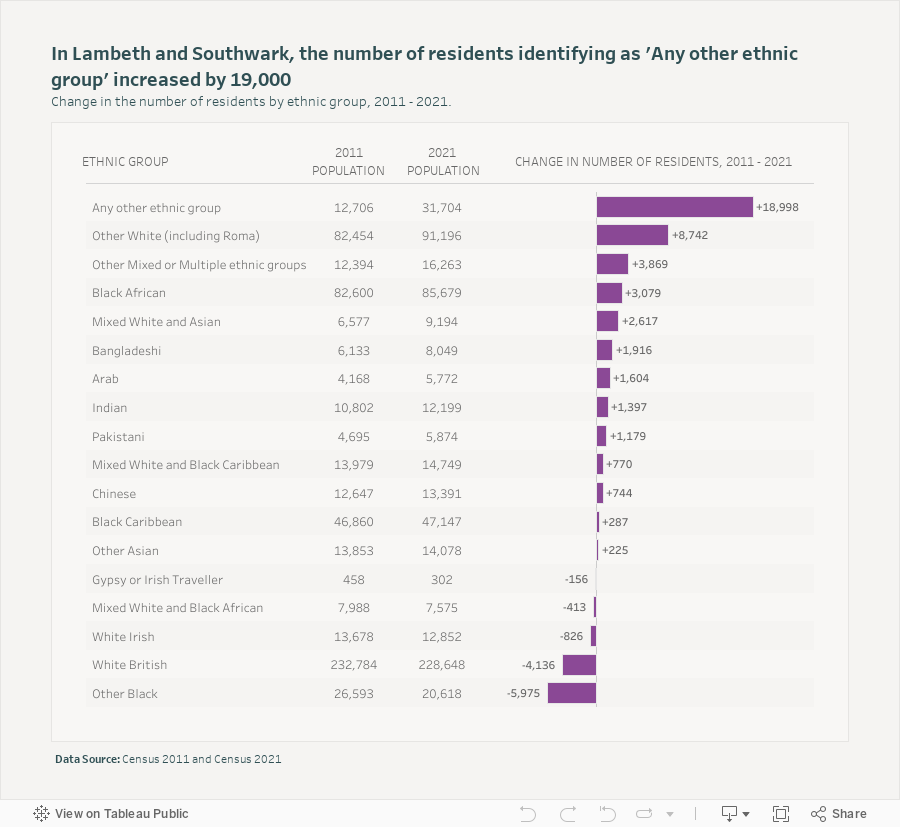
Lambeth and Southwark have also become more ethnically diverse. 63% of the population now identify as a “non White–British” ethnic group. The number of people who opted to write-in their ethnicity increased by 150% to 31,704. Within this group, almost half self-identified as Hispanic or Latin American.
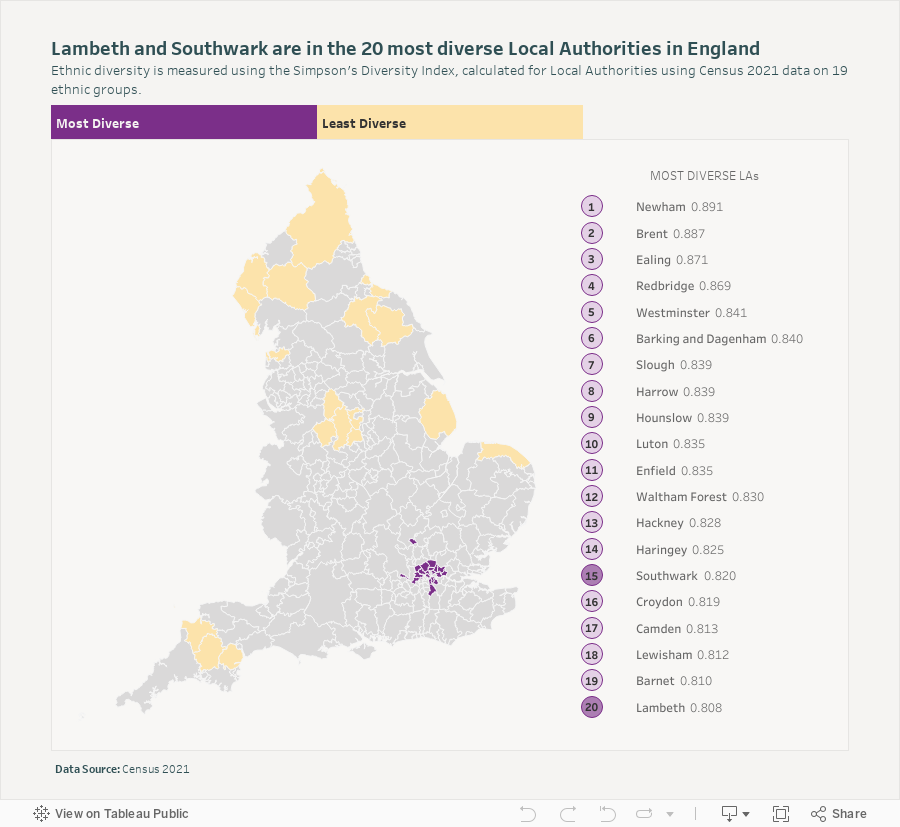
The most ethnically diverse areas in England are: Newham, Brent, and Ealing. All three Local Authorities are in London.
18 of the 20 most diverse Local Authorities are in London.
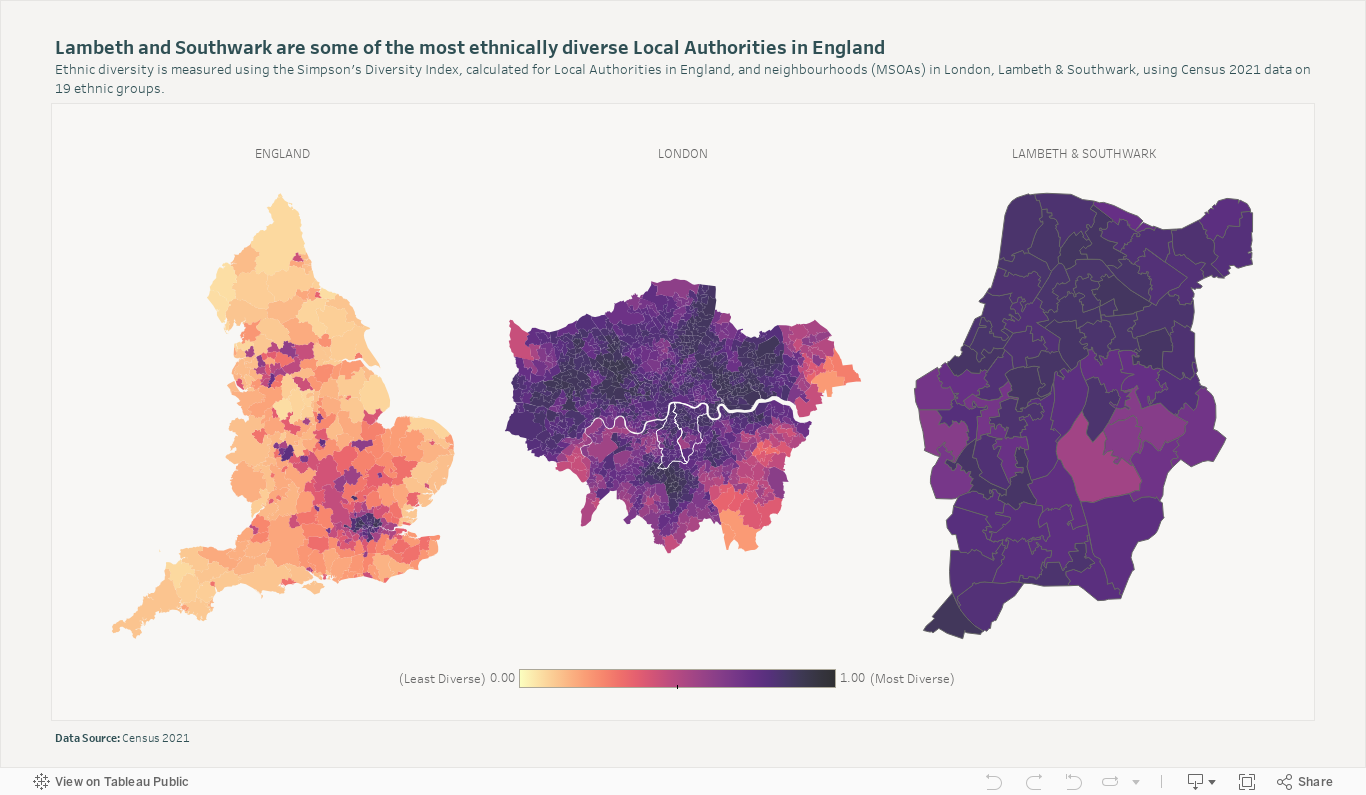
Out of 333 Local Authorities in England, Lambeth and Southwark are the 20th and 15th most ethnically diverse.
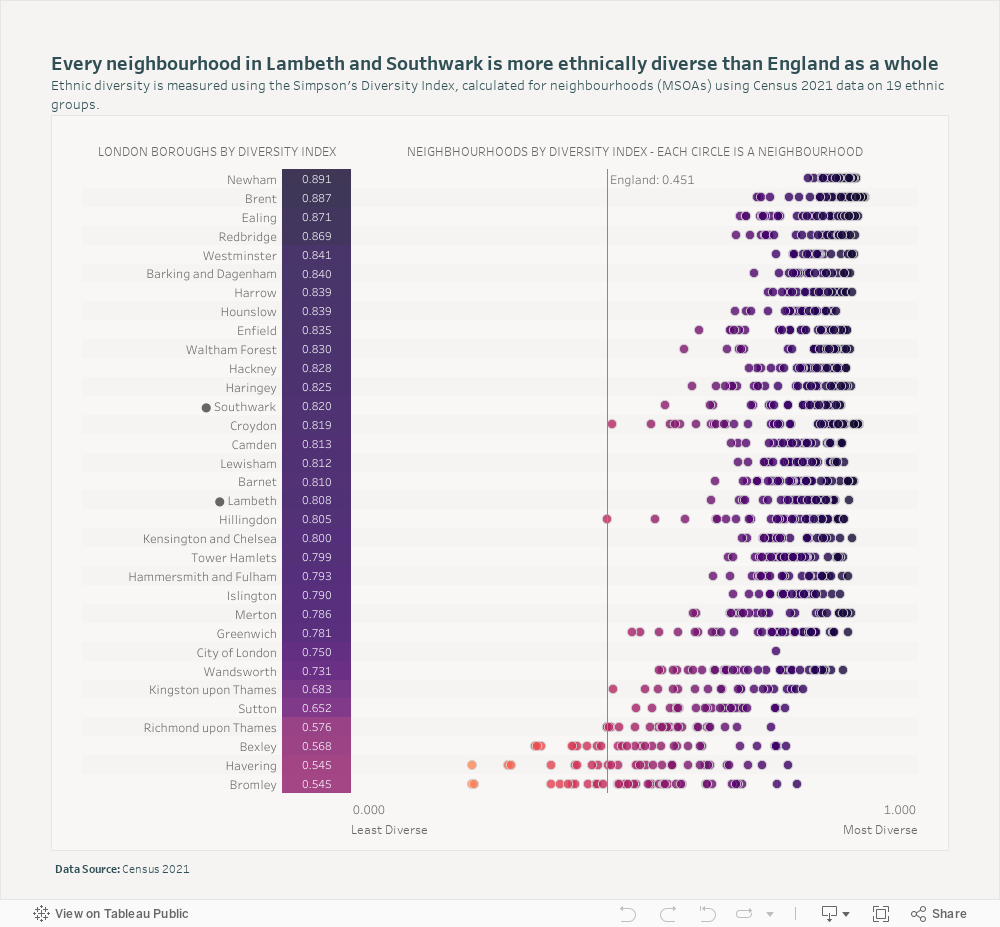
London boroughs have a higher diversity than most in England. But levels of diversity vary within their smaller neighbourhoods. For example, all neighbourhoods in Newham are very diverse (SDI> 0.8), whilst other boroughs may be very diverse as a whole but show more variation at the neighbourhood level.
All neighbourhoods in Lambeth & Southwark have a higher diversity than England (SDI=0.451). Streatham Vale in Lambeth is the most diverse (SDI = 0.88) and Herne Hill & Dulwich Park in Southwark is the least diverse (SDI= 0.55).
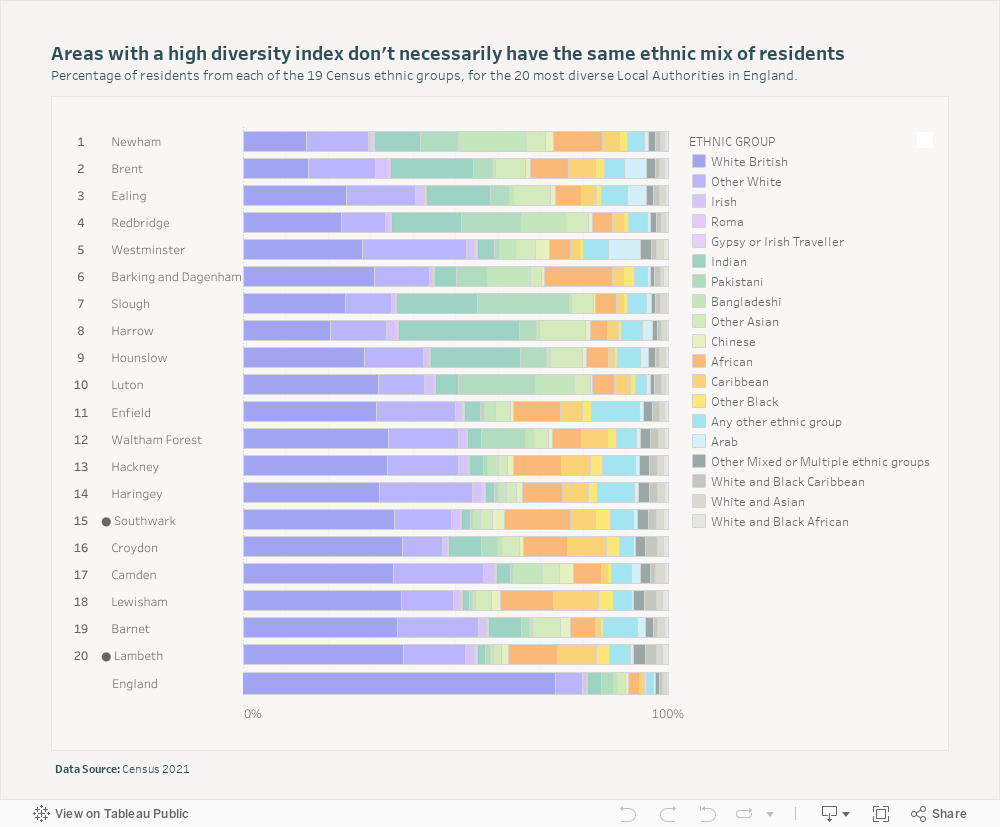
Areas can have the same diversity index score but a very different ethnic composition. The most diverse local authorities have a very different mix of ethnic groups. For example, Westminster and Redbridge have a very similar Diversity Index score. But just under 50% of residents in Redbridge are from Asian backgrounds, compared to only 17% of residents in Westminster.
A quarter of the population in Lambeth and Southwark is from a Black ethnic group, the highest proportion after Lewisham. But both boroughs have a smaller percentage of people from Asian background compared to other very ethnically diverse areas.
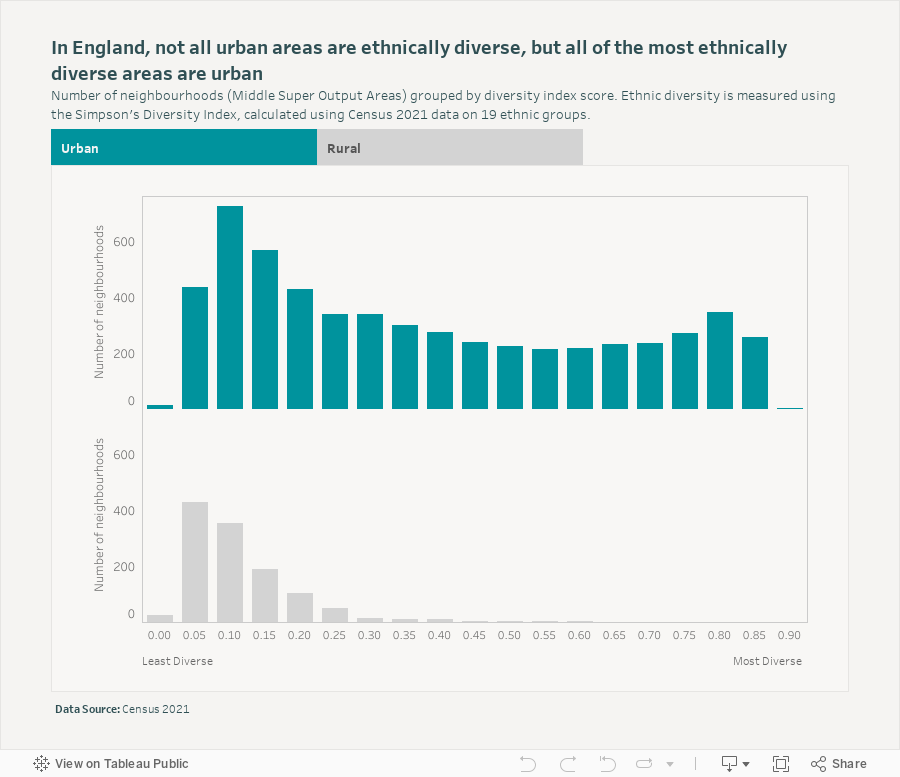
Analyses of the ethnic diversity of neighbourhoods in England shows that ethnic diversity is a characteristic of many urban areas. This does not mean that all urban areas are ethnically diverse, but that all the areas that are very ethnically diverse are urban. 90% of neighbourhoods classified as rural have a diversity index below 0.2, and only a handful of them have an index greater than 0.5.
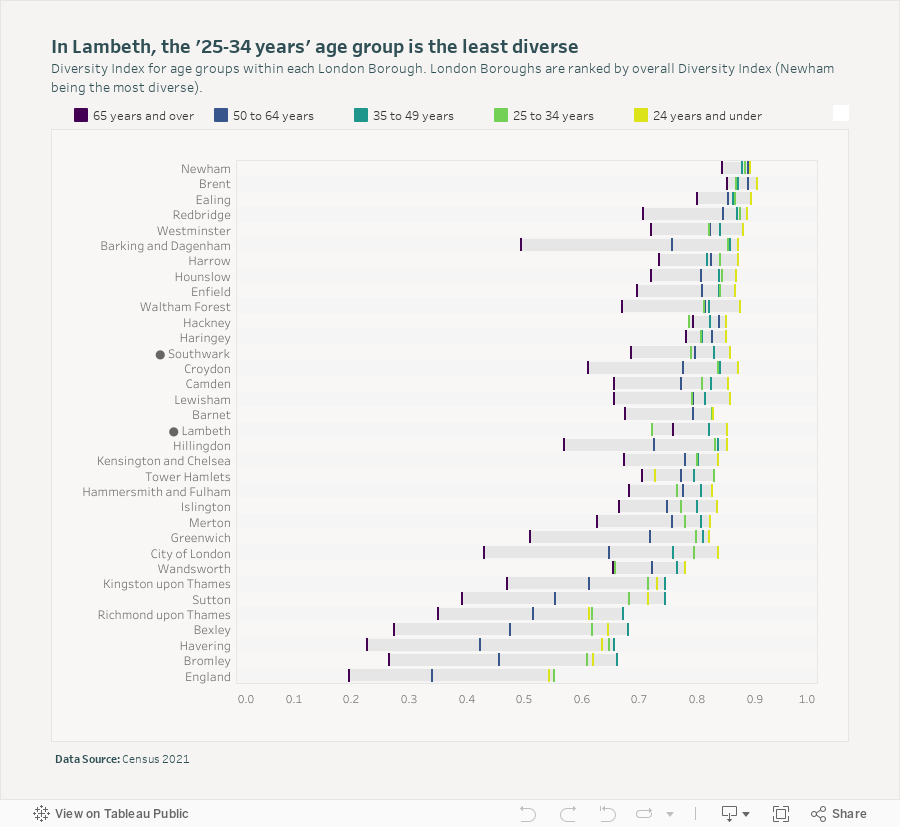
In 2021, ethnic diversity in Lambeth & Southwark, as for the majority of London boroughs, was higher amongst the youngest population. 70% of residents under 24 in our boroughs are from “non White-British” ethnic groups.
Generally, the oldest age group is the least diverse. Yet this is not the case in Lambeth and Hackney. In both of these boroughs, the least diverse age group is 25 – 34 years.
To improve health equity, we have to understand ethnic diversity and how the urban environment affects people differently. Our research has shown that some minority ethnic groups face the biggest health inequalities. Both Lambeth and Southwark have incredibly ethnically diverse populations, and the proportion of people with two or more long-term conditions is higher among Black communities.
Therefore, it is essential that we consider ethnicity, and use this in intersection with other measures when trying to understand the population.
Our work focuses on improving health equity across Lambeth and Southwark. We will use this data to ensure initiatives are tailored to our population, in the programmes we develop and the partners we work with.
The census is undertaken by the Office for National Statistics every 10 years. It gives us a picture of all the people and households in England and Wales.
The 2021 Census asked respondents to choose which ethnic groups or backgrounds best describes them from a list of 19 options. There was also an additional option to add it in writing.
We have used the Simpson’s Diversity Index (SDI) methodology to measure community diversity and what it means for Lambeth and Southwark. The index reflects the probability that any two individuals selected at random will belong to a different ethnic group. It takes values between 0 and 1; a high score indicates higher diversity.
Data and analytics

Our data team investigate what the 2021 census reveals about Lambeth and Southwark.
Data
Explore the Urban Health Index, which looks at the social and environmental factors that shape the health of people living in Lambeth and Southwark.
Data
If we want to improve health outcomes, it is essential that we understand people’s homes.