UK’s legal limits and WHO’s guidelines
In 2021, the WHO updated its air quality guidelines, setting lower recommended annual mean concentrations that should be met to protect public health, including interim targets to encourage progress.
- The NO2 guideline was reduced to 10 µg/m3 (interim targets of 20 µg/m3 and 30 µg/m3)
- The PM5 guideline was reduced to 5 µg/m3 (interim of 10 µg/m3)
- The PM10 guideline was reduced to 15 µg/m3 (interim of 20 µg/m3).
The current legal limit for PM2.5 in the UK remains at 20 µg/m³. However, the Environment Act sets a legally binding statutory target to reduce PM2.5 to 10 µg/m³. The Government’s most recent Environmental Improvement Plan commits to meeting this concentration across England by 2030, ahead of the Act’s 2040 deadline.
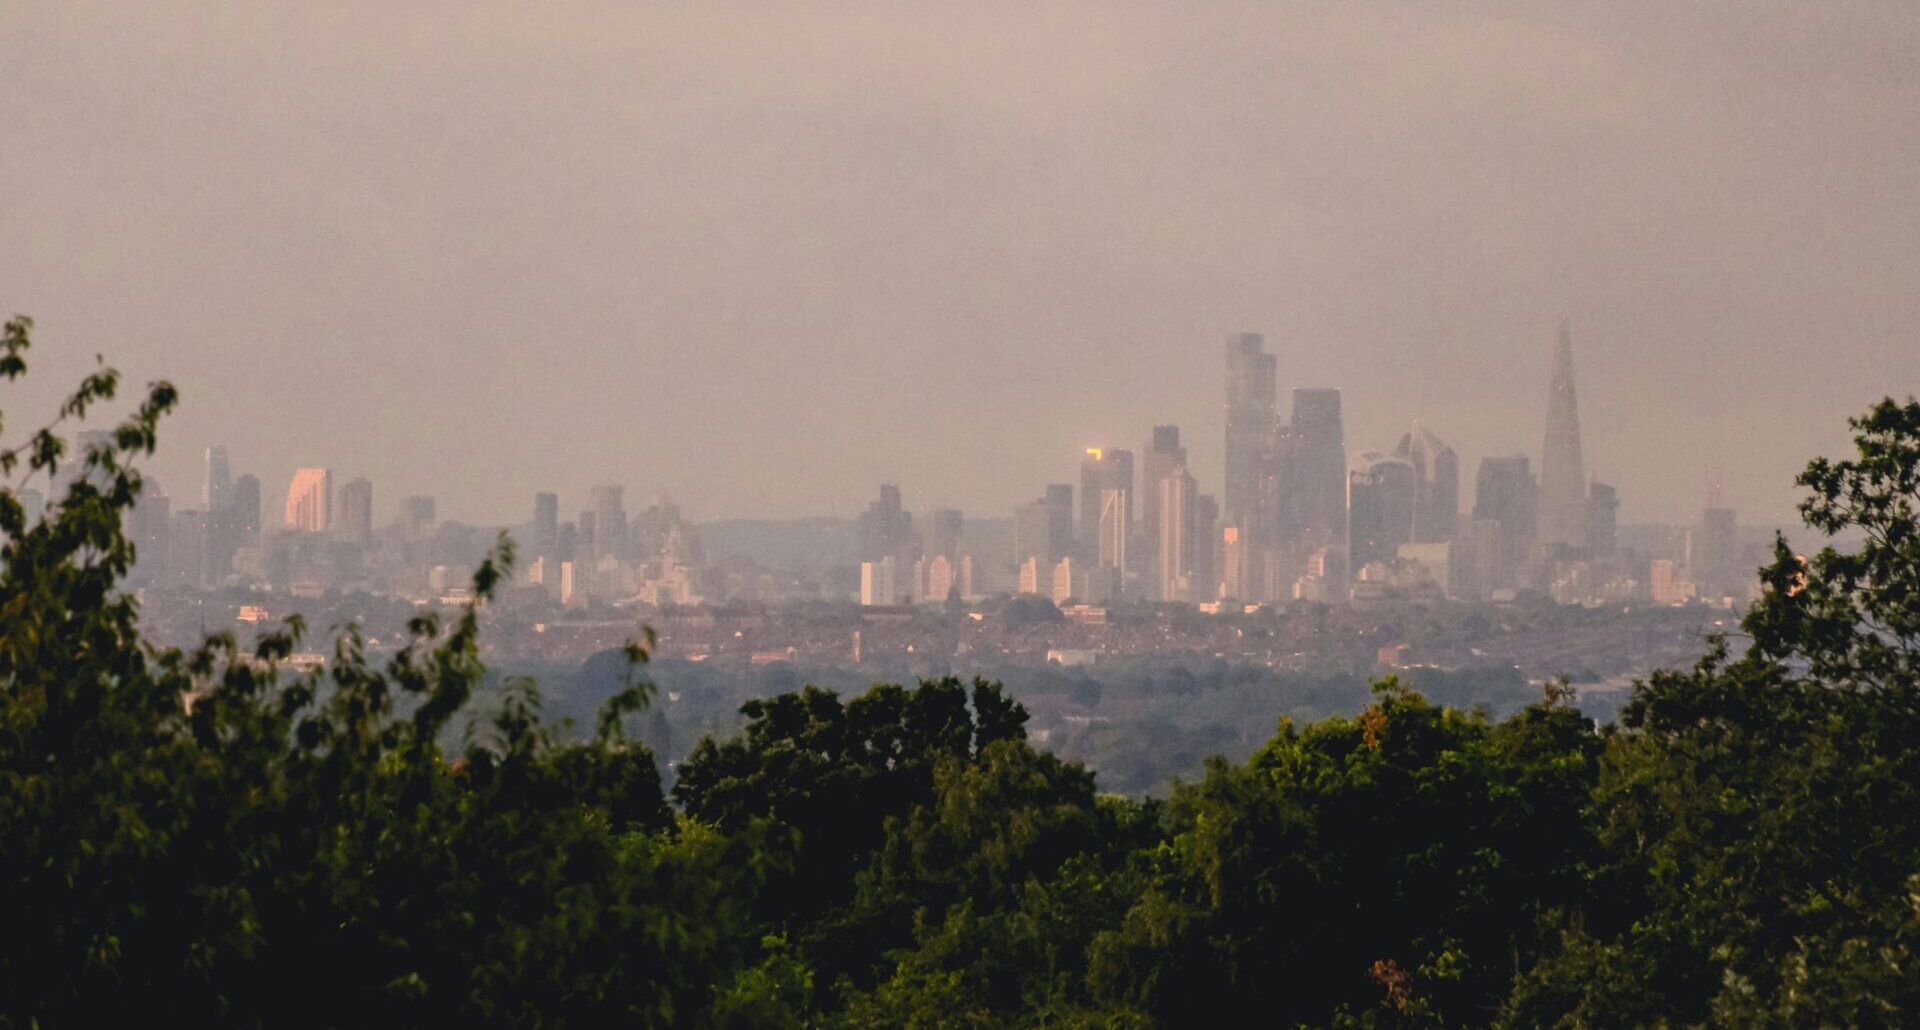
Air pollution levels fall across London between 2019 and 2022
Across Greater London, all three pollutants saw a decrease in mean annual concentrations between 2019 and 2022.
Annual mean NO2 concentrations decreased by 23% from 2019, to 20.1 µg/m3 in 2022 (2). Several boroughs now meet the WHO interim target of 20 µg/m3, though all remain above the WHO guideline of 10 µg/m3.
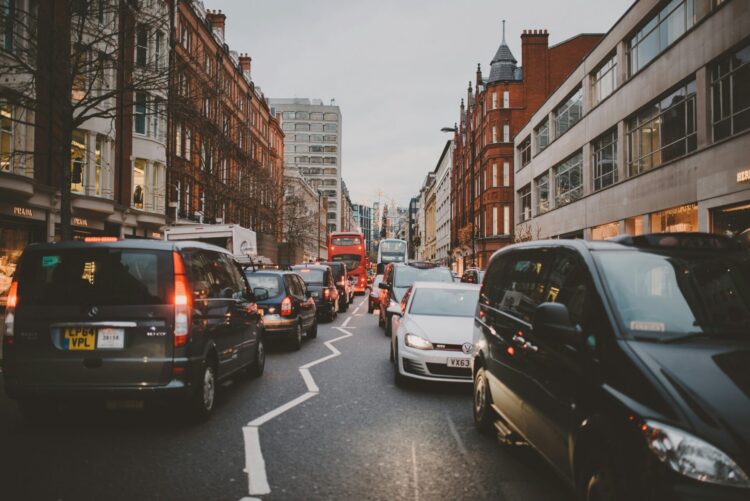
This reduction is likely due to measures like the ULEZ and an increase in cleaner vehicles and is expected to continue following increased expansion of the ULEZ in August 2023, according to the LAEI 2022 Summary Note December 2025 (pdf).
PM2.5 annual mean concentrations decreased by 15.1% compared to 2019, with an average of 8.8 µg/m3 in 2022. Most boroughs, except a few in inner London – Islington (10.1 µg/m3), Kensington and Chelsea (10.1 µg/m3), Westminster (10.4 µg/m3) and City of London (10.9 µg/m3) – now meet the WHO interim target of 10 µg/m3, however, all boroughs remain above the stricter WHO guideline of 5 µg/m3.
PM10 annual mean concentrations were 7.7% lower in 2022 than 2019, at 14.6 µg/m3, a smaller improvement compared to NO2 and PM2.5. Average concentrations of PM10 in inner London boroughs remain above the WHO guideline of 15 µg/m3, however, many outer London areas are now below the guideline.
Borough level analysis highlights local realities
Across all boroughs and pollutants, the only increase from 2019 was in Hackney, where PM10 increased by 3.6%.
The City of London had the highest average concentrations for all three pollutants but also saw the largest decrease in both PM2.5 (18%) and PM10 (13.3%) and one of the highest decreases in NO2 (24.3%), suggesting that measures to reduce air pollution in the city centre are having an impact.
Other inner-city boroughs with the highest concentrations include Westminster, Kensington and Chelsea, Hackney, Islington, Tower Hamlets, Camden and Southwark.
Outer boroughs such as Havering, Bromley, Bexley and Harrow had some of the lowest concentrations across the three pollutants, with Havering also showing one of the biggest decreases in NO2 (25.9%) and PM2.5 (17.7%).
Hillingdon and Camden had the largest variation in NO2 at ward level within a borough, possibly linked to emissions related to King’s Cross St Pancras station and Heathrow airport. For example, Hillingdon NO2 concentrations ranged from 14.9 µg/m3 in Harefield village to 27.2 µg/m in Heathrow villages, while Camden’s St Pancras and Somers Town had the highest ward-level NO2 at 34.7 µg/m3. Despite these localised high concentrations, average concentrations in these boroughs were still lower than in inner-city areas.
Next steps: Meeting WHO guidelines
The new LAEI data show that London has made progress in reducing air pollutant concentrations since 2019 and many areas now meet interim targets for NO2, PM2.5 and PM10.
However, more work must be done to meet the stricter WHO guidelines to protect public health, and reduce persistent health inequalities, particularly for inner London boroughs where concentrations are highest.
That’s why the government must enshrine the right to breathe clean air in law and set legally binding targets aligned with the World Health Organization’s 2021 guidelines. One way of doing this is by passing Ella’s Law, which was recently reintroduced to Parliament as a Private Members Bill in 2025.