How has the population changed in Lambeth and Southwark?
Our data team investigate what the 2021 census reveals about Lambeth and Southwark.
Read more
Children's health and food
Our new tool shows how a schoolchild's commute to and from school is a prime example of how where we live, play and go to school shapes our health.
We know that children’s chances of accessing healthy and nutritious food – or being flooded with unhealthy food – depend strongly on where they grow up. Our new tool shows how a schoolchild’s commute to and from school is a prime example of how where we live, play and go to school shapes our health.
Our research with urban design firm Gehl on learning from London’s foodscape highlighted how fast-food outlets near schools and transit routes effectively act as bus stops. The research found that junk food is dotted along bus routes, and that children spend time at these outlets after school with their friends, waiting for their bus home over a snack in a warm environment that helps them feel safe, social and empowered.
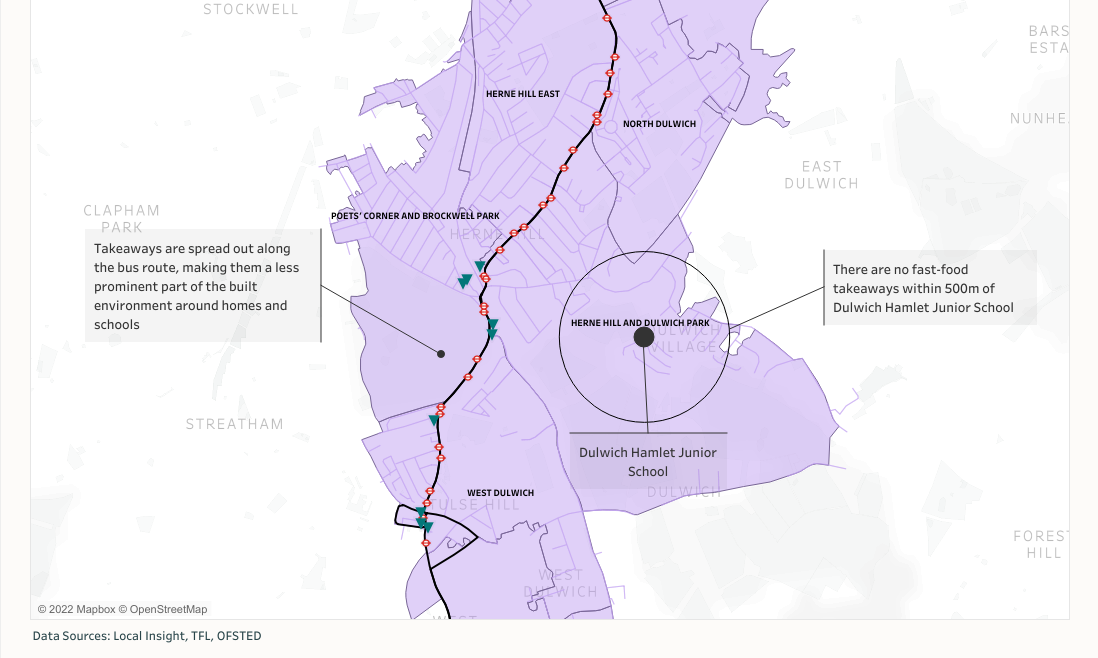
We created a tool that allows users to visualise a child’s bus journey from home to school and track the number of unhealthy food outlets they are exposed to along the way. We put school catchment area data together with TfL bus routes, food outlets, Index of Multiple Deprivation (IMD) scores, and obesity rates to understand what a typical journey for children in different neighbourhoods could look like, and how easy it could be to pick up an unhealthy snack on the way home.
We focused on two typical schools in areas with very different IMD scores: Dulwich Hamlet Junior School (Dulwich) and St. James the Great Roman Catholic Primary School (Peckham).
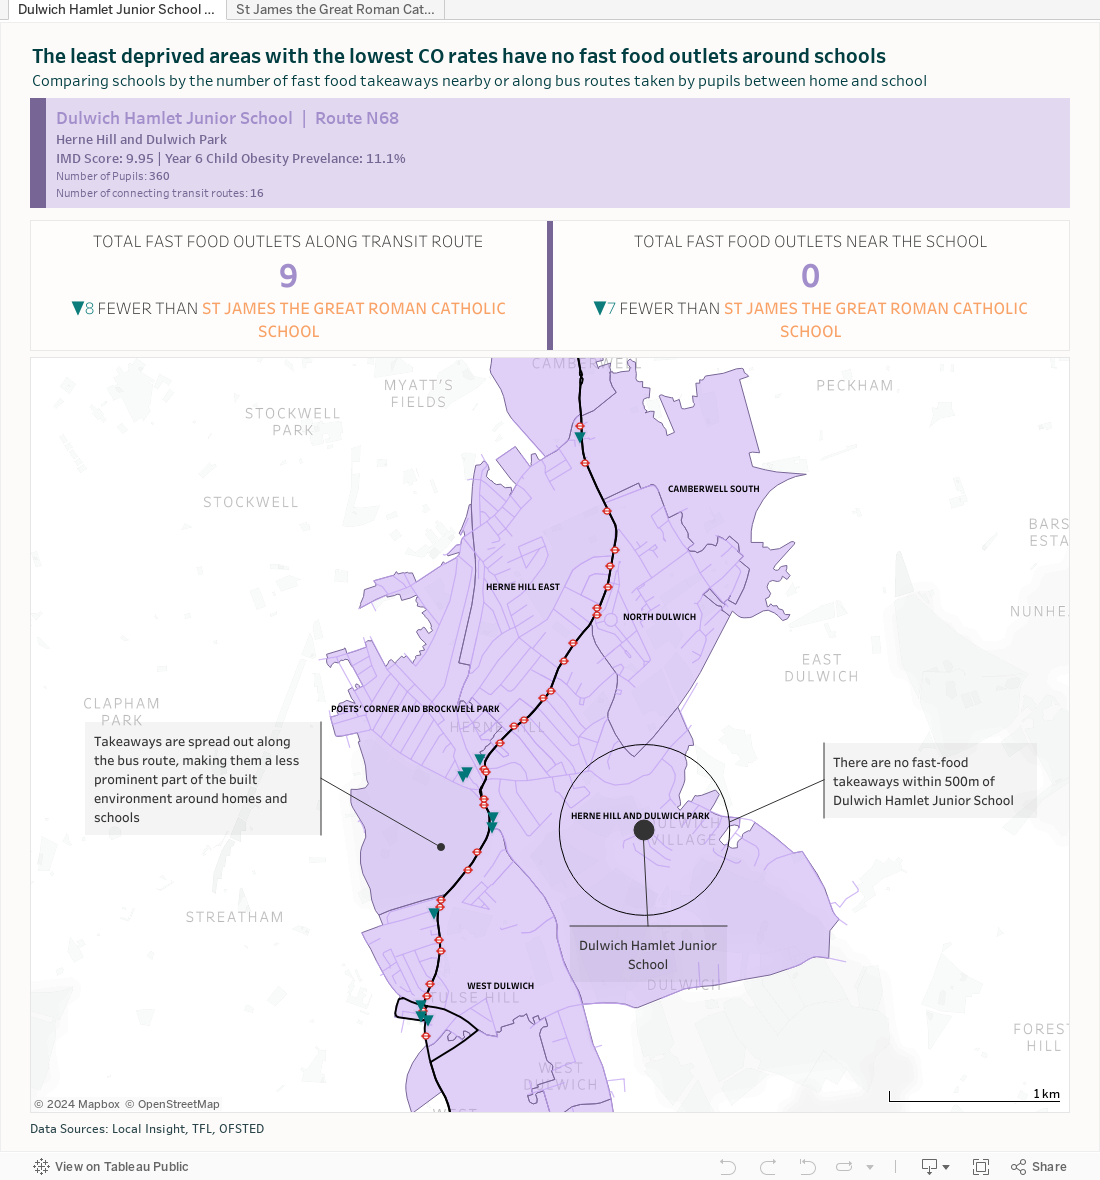
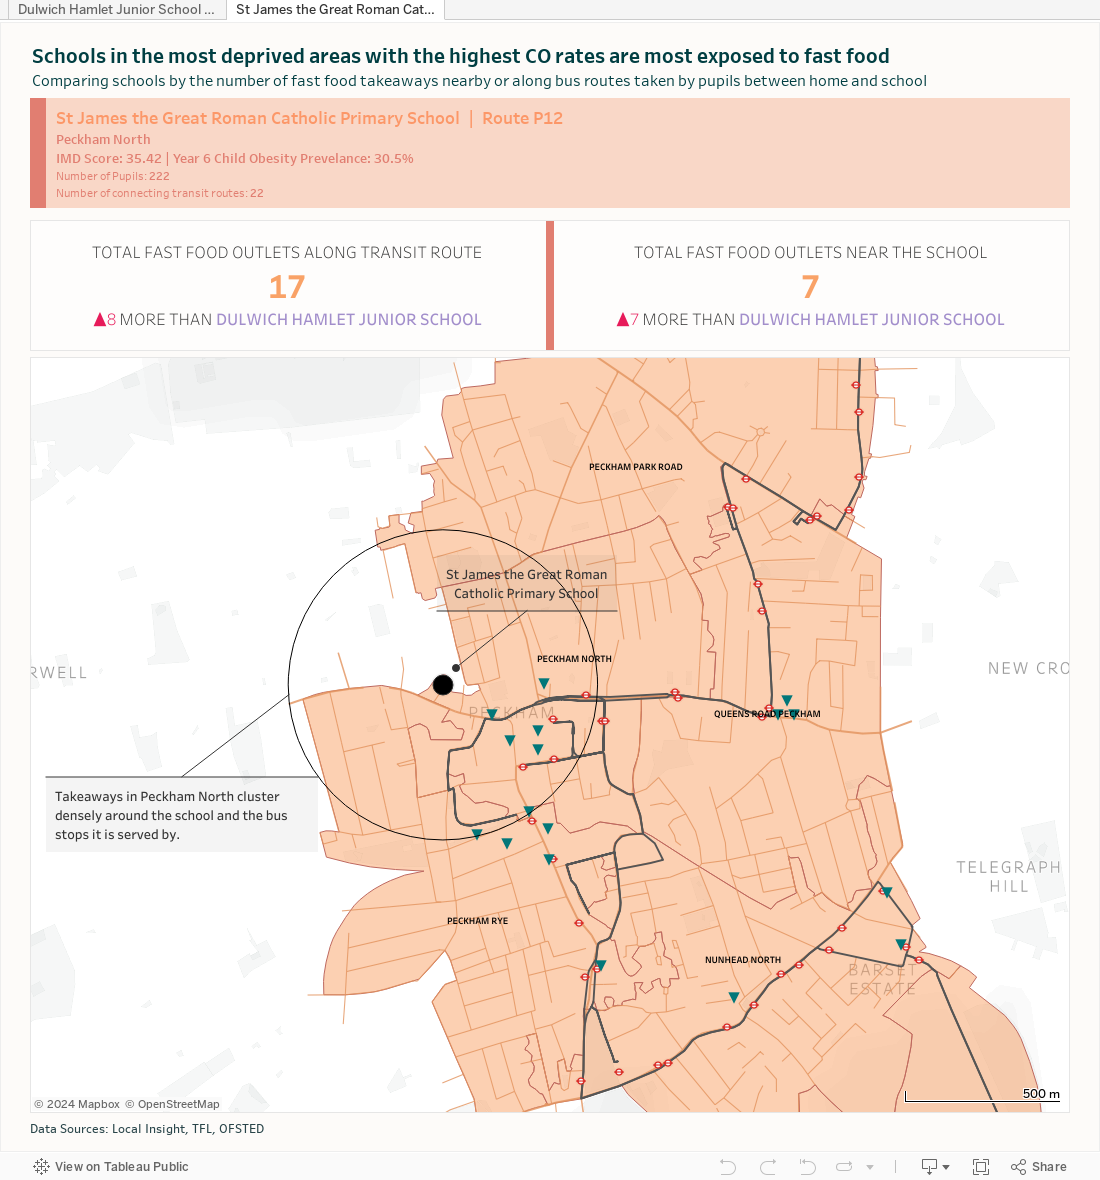
We found that nearly half of the children living in neighbourhoods with the highest levels of both deprivation and obesity also go to school in areas with characteristics that mirror their neighbourhood. Those living in areas with the highest rates of both deprivation and obesity in London also have the most exposure to junk food.
These areas represent just 7% of all neighbourhoods in our boroughs, but all of them have a higher-than-average number of unhealthy food outlets immediately around the homes, schools, and bus stops within them.
The data shows that the children who are most at risk of obesity are also those who are most exposed to junk food on their daily school commute.
We work with partners to change the spaces where children and families spend time outside of home and school. Our areas of focus include:
Data and analytics

Our data team investigate what the 2021 census reveals about Lambeth and Southwark.
Urban health
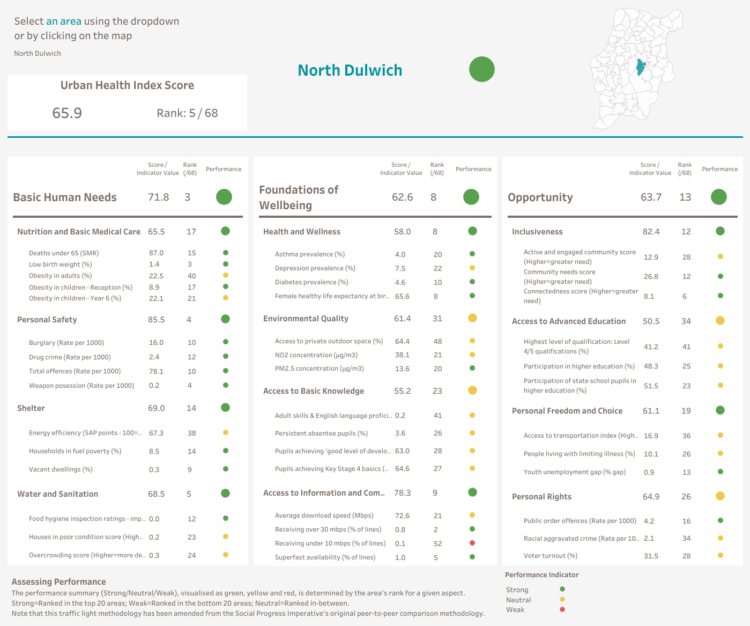
With the Social Progress Imperative, we've developed the first neighbourhood level, health-focused social progress index of its kind.
Data and analytics • Urban health
The difference in healthy life expectancy between the richest and poorest neighbourhoods in Lambeth and Southwark is up to 17 years. Explore our data snapshot to find out what factors contribute to this inequality.